Debugging Python programs
There are different ways to debug Python programs, from printing information to the console using the basic print() function to using a full-fledged debugger. In this article we will have a look at some basic tools that we can use, including less known tools like PySnooper or stackprinter.
I have created an accompanying repository python-debugging with all the examples, so you can check it out and try all the tools yourself. All examples follow a simple for loop where we are trying to see what is happening inside of it at every iteration. Please make sure that you follow installation and usage instruction in the README.
Contents:
Examples for this article can be found in the python-debugging repo.
Using vars() and locals()
The vars([object]) function can be used to investigate modules, classes, instances, and other objects that define a __dict__ attribute. Without a parameter, vars() behaves like locals(), returning a dictionary with the local context. So for instance, it is possible to see all defined variables in the current scope at once.
Debugging with f-strings
Since print() function is the most used way to debug Python applications during development, let’s start here. f-strings (formatted string literals) are available from Python 3.6 and they are arguably the most intuitive way to quickly include variables in our strings. Therefore it makes perfect sense to use them together with print()to print our data during execution of the program:
words = ['debugging', 'with', 'console', 'f-strings']

def process_words(words_to_process):
    for i, word in enumerate(words_to_process):
        processed_word = str.capitalize(word)
        print(f"i={i}, processed_word={processed_word}")

process_words(words)
In Python 3.8, the f-string syntax will be enhanced with = specifier to make the debugging syntax even shorter:
words = ['debugging', 'with', 'console', 'f-strings']

def process_words(words_to_process):
    for i, word in enumerate(words_to_process):
        processed_word = str.capitalize(word)
        print(f"{i=}, {processed_word=}")

process_words(words)
The output will be:
i=0, processed_word=Debugging
i=1, processed_word=With
i=2, processed_word=Console
i=3, processed_word=F-strings
Link to the example: Debugging with f-strings.
Debugging with PySnooper
What if we want to still use the same technique, printing information about our data to the console, but we don’t want to do that manually? PySnooper is a very neat tool to do just that. With a simple import and an annotation, we will get an extensive amount of information to our console. PySnooper will print the state of the program after each executed line of code from the annotated function:
import pysnooper

words = ['debugging', 'with', 'PySnooper']

@pysnooper.snoop()
def process_words(words_to_process):
    for i, word in enumerate(words_to_process):
        processed_word = str.capitalize(word)

process_words(words)
The PySnooper will output this for us automatically:
Starting var:.. words_to_process = ['debugging', 'with', 'PySnooper']
12:04:18.919933 call        15 def process_words(words_to_process):
12:04:18.920111 line        16     for i, word in enumerate(words_to_process):
New var:....... i = 0
New var:....... word = 'debugging'
12:04:18.920229 line        17         processed_word = str.capitalize(word)
New var:....... processed_word = 'Debugging'
12:04:18.920332 line        16     for i, word in enumerate(words_to_process):
Modified var:.. i = 1
Modified var:.. word = 'with'
12:04:18.920437 line        17         processed_word = str.capitalize(word)
Modified var:.. processed_word = 'With'
12:04:18.920526 line        16     for i, word in enumerate(words_to_process):
Modified var:.. i = 2
Modified var:.. word = 'PySnooper'
12:04:18.920635 line        17         processed_word = str.capitalize(word)
Modified var:.. processed_word = 'Pysnooper'
12:04:18.920754 line        16     for i, word in enumerate(words_to_process):
12:04:18.920846 return      16     for i, word in enumerate(words_to_process):
Return value:.. None
There is a lot of options available, but I will mention just one thing here. Instead of using an annotation to mark a whole function, PySnooper’s pysnooper.snoop() is both a decorator and a context manager with which it is easy to debug just a small amount of code (and we don’t even have to have any functions defined):
import pysnooper

with pysnooper.snoop():
    ... # here goes the code we want to debug
Link to the example: Debugging with PySnooper.
Debugging with logging
Staying still within the printing realm of debugging, we can step up the game with a logging library. We can of course use any of the logging libraries available for Python, but I chose to use logging module from the standard library as it is already pre-installed.
Using a logging library is useful for debugging applications in production, and there are a lot of options to configure. In our example we will print some additional information (function name, line number), use different importance level of the message (debug, error) and print our messages to the console as well as to a file on the disk, to demonstrate at least some of the advantages over normal print().
import logging

FORMAT = '%(levelname)-8s %(funcName)s() %(lineno)d\t %(message)s'
formatter = logging.Formatter(FORMAT)

logger = logging.getLogger(__name__)
logger.setLevel(logging.DEBUG)

console_handler = logging.StreamHandler()
console_handler.setFormatter(formatter)
logger.addHandler(console_handler)

file_handler = logging.FileHandler("log.txt")
file_handler.setFormatter(formatter)
logger.addHandler(file_handler)

words = ['debugging', 'with', 'default', 'logging', 42]

def process_words(words_to_process):
    for i, word in enumerate(words_to_process):
        try:
            processed_word = str.capitalize(word)
            logger.debug('i=%d, processed_word=%s', i, processed_word)
        except TypeError:
            logger.error('The word is not a string')

process_words(words)
The output from such a configured logger will be:
DEBUG    process_words() 47	 i=0, processed_word=Debugging
DEBUG    process_words() 47	 i=1, processed_word=With
DEBUG    process_words() 47	 i=2, processed_word=Default
DEBUG    process_words() 47	 i=3, processed_word=Logging
ERROR    process_words() 49	 The word is not a string
Link to the example: Debugging with logging module.
Debugging with breakpoint() and pdb
Python comes with its own Python debugger called pdb. As pdb is a proper debugger, we can do many things with it. In this example we will use a built-in function breakpoint() to stop the execution of our program inside the loop and then investigate our variables as we go through our loop. Let’s have a look at the code:
words = ['debugging', 'with', 'breakpoint()']

def process_words(words_to_process):
    for i, word in enumerate(words_to_process):
        processed_word = str.capitalize(word)
        breakpoint()

process_words(words)
When this code runs on the command line, the program stops on the breakpoint line and an interactive pdb session is opened for us. It accepts commands that are executed by hitting enter as is normal on the command line. We can investigate the variables (i, processed_word) just by typing their name and hitting enter. To continue the execution and move to the next iteration, we can use command named continue.
I am including a record of such a session where I examine both of our variables at each step of the iteration:
> python-debugging/debug_with_breakpoint.py(22)process_words()
-> for i, word in enumerate(words_to_process):
(Pdb) i
0
(Pdb) processed_word
'Debugging'
(Pdb) continue
> python-debugging/debug_with_breakpoint.py(22)process_words()
-> for i, word in enumerate(words_to_process):
(Pdb) i
1
(Pdb) processed_word
'With'
Link to the example: Debugging with breakpoint() and pdb.
Debugging with VSCode
Very nice and comfortable debugging can be achieved with Visual Studio Code and Python extension.
Before we can use the debugging feature, we need to make sure that the Python path is correctly set for the project in VSCode. VSCode shows the Python version in the lower left corner and you can easily change this path just by clicking on it.
When this is done, we can go to the Debug panel and create our debug configuration. VSCode makes it easy to create a configuration for Flask, Django and Pyramid frameworks, but for our example, we will choose a simple Python file option.
The only thing left is to set our breakpoints. This is done by clicking on the left side of the line number on which we want to stop the program’s execution. Now when we run our debug session with the green play arrow, the program is executed and stopped on the marked line.
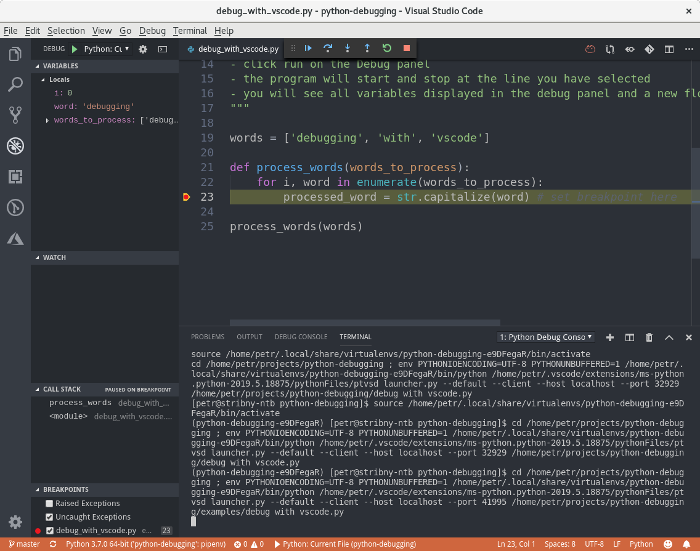
The left panel offers us a view of our variables and a new floating menu allows us to control the execution of the program.
Link to the example: Debugging with VSCode.
Debugging with stackprinter
stackprinter is a library that can provide nicer stack traces for our exceptions. Let’s setup stackprinter and produce an exception:
import stackprinter
stackprinter.set_excepthook(style='darkbg2')

words = ['debugging', 'with', 'stackprinter', 42]

def process_words(words_to_process):
    for i, word in enumerate(words_to_process):
        processed_word = str.capitalize(word)

process_words(words)
When we run this, we will see the stack trace in the stackprinter’s own format instead of the default stack trace output:
File debug_with_stackprinter.py, line 22, in <module>
    18   def process_words(words_to_process):
    19       for i, word in enumerate(words_to_process):
    20           processed_word = str.capitalize(word)
    21
--> 22   process_words(words)
    ..................................................
     words = ['debugging', 'with', 'stackprinter', 42, ]
    ..................................................

File debug_with_stackprinter.py, line 20, in process_words
    18   def process_words(words_to_process):
    19       for i, word in enumerate(words_to_process):
--> 20           processed_word = str.capitalize(word)
    ..................................................
     words_to_process = ['debugging', 'with', 'stackprinter', 42, ]
     i = 3
     word = 42
     processed_word = 'Stackprinter'
    ..................................................

TypeError: descriptor 'capitalize' requires a 'str' object but received a 'int'</module>
Link to the example: Debugging with stackprinter.
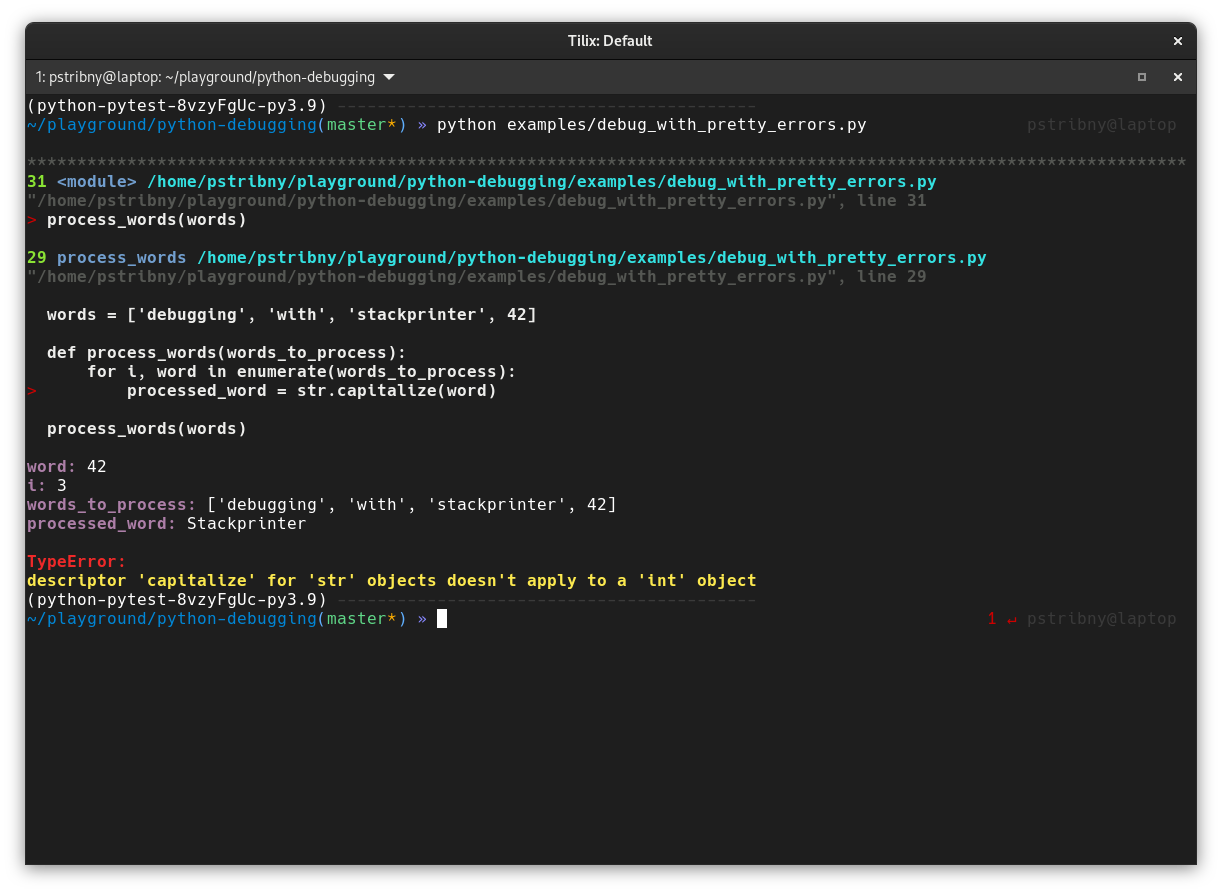
Debugging with PrettyErrors and alternatives
There are many other projects that work like stackprinter. I recommend you to have a look at PrettyErrors and Pretty Traceback. This is how PrettyErrors would display the output in the terminal, with colors and all:
Debugging with Cyberbrain
Cyberbrain is the new kid on the block. It is a visual debugging tool that we can use e.g. in VSCode to see how the state of the program changes over time. It could become a nice learning tool for beginners.
Debugging with pytest
Sometimes the best option is to first narrow-down the search for the problem with good old automated testing. I have written a guide Testing Python Applications with Pytest just for that.
And this is all for now! Happy debugging!
Last updated on 23.6.2019.